clawdwatch is a Triptech Travel open-source project — authored and released by Isaac Rowntree in his Triptech engineering capacity, and cross-posted here on the Zack Design blog, alongside clickup-cli and slackbuzz-cli. It is an uptime monitor that requests your endpoints on a schedule, and it runs entirely inside a single Cloudflare Worker (a small program on Cloudflare’s servers): a timer runs the checks, a state machine with no hidden inputs decides when something is genuinely broken, and the result goes to Slack, a signed webhook, a direct call to another Worker, or an AI agent. The version it replaces alerted exactly once on a multi-day outage and then went silent while still down. This one is 3,840 lines of production TypeScript with 3,801 lines of tests beside it — 271 unit tests and 40 more against a real database in workerd, the open-source runtime that Workers run on. MIT licensed.
This post walks through what the v3 rewrite changed and why: the “still unhealthy” transition the old state machine could not express, why three storage systems became one (the rewrite commit deleted 2,386 lines), how a secret can be referred to by name in a database anyone with the dashboard can edit without its value ever landing in a row, why a failing response body is scrubbed of secrets before it is cut short, the test that keeps the API document an agent reads in step with the routes that exist, and the thing the docs claim about signed action links that the code does not yet do.
Source → github.com/triptechtravel/clawdwatch · Docs → triptechtravel.github.io/clawdwatch
Where the model is allowed, and where it is not
There is an obvious version of an AI-era monitoring tool where a model looks at the response and decides whether you have a problem. clawdwatch does not do that. Detection is a threshold, a state machine and a maintenance window — code you can read in an afternoon and reason about at 3am. What the AI gets is the other half of the job: the part after “this is broken”, where somebody has to work out why.
Everything below is either “make the detection boring and trustworthy” or “make the handoff useful.”
The state machine could not say “still down”
The transition function is 118 lines in src/engine/transition.ts, and its signature is the design:
export function computeTransition(
  state: CheckState,
  result: CheckResult,
  check: CheckConfig,
  now: number,
  nextIncidentId: string,
): { state: CheckState; transition: Transition } {
The current time is passed in as a parameter and never read from the system clock; the incident id is supplied by the caller. That is what lets the test suite walk a check through a week of results in 273 lines without a clock. Four states, unknown, healthy, degraded and unhealthy, and the moves between them:
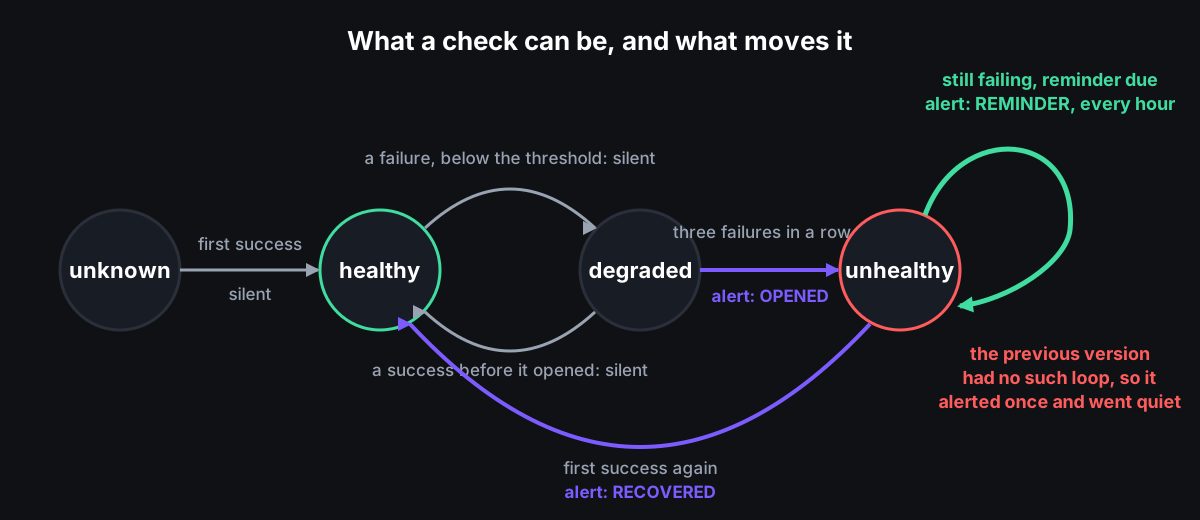
The threshold defaults to three consecutive failures. The move that matters is the loop from unhealthy back to unhealthy. The file header records the bug it fixes: in v2 that case returned nothing forever, so a multi-day outage alerted once on day one and then went quiet while still down. Reminders can only be sent if the state machine has a name for “still broken, and it has been a while”:
  // Already unhealthy: remind only when the cadence has elapsed.
  const interval = check.reminderIntervalMs;
  const lastAlert = state.lastAlertAt ? Date.parse(state.lastAlertAt) : null;
  const downSince = state.downSince ? Date.parse(state.downSince) : now;

  if (interval !== null && lastAlert !== null && now - lastAlert >= interval) {
    next.lastAlertAt = at;
    return {
      state: next,
      transition: { kind: 'reminder', downSinceMs: Math.max(0, now - downSince) },
    };
  }
The default cadence is one hour; null turns reminders off. The test drives a sustained failure through the function and asserts the sequence ['opened', 'reminder', 'none', 'reminder'].
Two more v2 defects were structural, and the orchestrator’s header names them: checks ran one after another, so ten checks with a 10 s timeout and retries could use up the time the scheduled run was allowed, and alerts fired one per check inside that loop, so a ten-endpoint outage was ten notifications. Now checks run six at a time, transitions are collected per run into opened, recovered and reminder events plus a single summary, and a quiet run emits nothing at all.
Three storage systems became one
D1, Cloudflare’s hosted SQLite. Six tables — checks, check_state, check_results, incidents, maintenance_windows, notifier_deliveries — in one migration whose header says what it replaced:
-- One storage system: D1. (v2 split hot state into an R2 JSON blob and
-- history into Analytics Engine that nothing ever read.)
That is not a figure of speech. The v2 state module opens with “R2 state persistence for monitoring … History is stored in Analytics Engine” (R2 is Cloudflare’s file storage and Analytics Engine its time-series store), and the orchestrator wrote a data point to Analytics Engine on every result. Nothing in v2 ever read that data back; the rewrite commit lists it as “Analytics Engine (write-only)”. Two storage systems, two consistency stories, a whole class of “which one is right?” bugs, for a dataset with no reader.
The rewrite commit touched 23 files: 3,058 insertions, 2,386 deletions. db.ts (370 lines) and state.ts (69) went; transition.ts (118), secrets.ts (195) and store/d1.ts (398) arrived. The integration suite applies the shipped migration and runs in workerd against a local stand-in for D1, so the SQL is exercised rather than mocked — 40 tests in 1.94 s.
One schema decision worth copying: check_state deliberately has no foreign key to checks(id). A run writes every check’s result and state in one batch, and if a check were deleted mid-run a foreign-key violation would fail the batch and silently lose that tick for every other check too.
Results are kept 48 hours (historyRetentionHours: 48) and pruned every run. The pruning of notifier_deliveries keeps MAX(id) per notifier, because alerts are sparse and deleting a notifier’s only row would make it vanish from the dashboard.
Public code, private config
Checks live in the database and are editable through the UI. That is only safe if a secret can never land in a row, so a check stores a reference:
{ "headers": { "X-Api-Key": "${MY_API_KEY}" } }
A reference is a name in ${...} braces, and it is turned into the real value at exactly one point, where the runner builds the request headers, throwing an error if a name is missing rather than sending an empty header. Every path leaving the system goes through scrub() first, which does the substitution in reverse — each literal value is replaced with its ${NAME}:
export function scrub(text: string, secrets: SecretMap): string {
  let out = text;
  for (const [name, value] of Object.entries(secrets)) {
    if (!value || value.length < MIN_SECRET_LENGTH) continue;
    out = out.split(value).join(`\${${name}}`);
  }
  return out;
}
MIN_SECRET_LENGTH is 8; shorter values are too common to treat as secrets. Alert payloads go further and carry a CheckSummary with headers and body dropped entirely, on the principle that what is absent cannot leak.
Writing a check that contains a literal secret value is rejected with a 400 whose message names the reference you should have used. The test posts a header of hc-super-secret-value and asserts the error contains ${HEALTHCHECK_SECRET}. And there is a test named property: no resolved secret escapes — not a generated property-based test, a hand-written exhaustive loop over five placements (a header, a Bearer authorisation header, a JSON body, a query string, all three at once) times every secret — asserting first that the write guard throws, and then that if the value had somehow reached storage, the API view, the alert summary and a log line are all clean.
That guard is what makes a dashboard-editable, database-backed monitor safe to open-source at all. For a token that belongs to a whole domain rather than one check — one that lets the monitor past a web application firewall, say — header rules keyed by host pattern carry the same references.
Keeping the thing that explains the outage
By default a response body is read to evaluate assertions and discarded; what is stored is the assertion message, truncated to 256 characters. A monitored endpoint that returns personal data does not leak it into the monitoring database.
But “expected 200, got 500” throws away the one thing that usually explains the outage. The motivating case was a health endpoint whose 500 body named the failing dependency, for five hours, while the alert carried none of it. So a check can opt in with "captureBodyOnFailure": true, and buildBodySnippet() is deliberately ordered:
export function buildBodySnippet(raw: string, secrets: SecretMap): string | null {
  const collapsed = scrub(raw, secrets).replace(/\s+/g, ' ').trim();
  if (collapsed === '') return null;
  return collapsed.length <= MAX_BODY_SNIPPET_LENGTH
    ? collapsed
    : `${collapsed.slice(0, MAX_BODY_SNIPPET_LENGTH - 1)}…`;
}
Scrub before truncating, so a secret straddling the cut is masked rather than half-printed. The cap is 512 characters — long enough for a JSON error or an HTML title, short enough that it cannot become a bulk exfiltration channel. Capture only runs when assertions failed, only for textual content types (the regex accepts text/*, JSON, XML, problem+json and *+json, and treats an absent content-type as textual because many error paths omit it).
The snippet reaches the webhook notifier and the dashboard, both already trusted with the monitoring database. It never reaches Slack: bodySnippet does not appear anywhere in slack.ts, and a test sets one to connection refused to db-primary and asserts neither string is in the rendered payload. Slack is a wide, retained audience.
Handing an incident to an agent
An agent inbox is just a URL, so webhook() is the whole integration. Every alert carries a links object — incident, ack, annotate, runNow, maintenance, capabilities — and GET /api/agent.md describes the API so an agent can act on what it was handed.
Here is where I have to correct the documentation, including my own. The docs say the action links “expire after about an hour”. The signing machinery exists: a function mints a link by signing the action and its expiry time with the same keyed hash the webhook notifier uses, a verifier checks the expiry and compares the signature in constant time, and the authentication layer accepts such a signature in the query string, scoped to one action. It is tested. But the orchestrator’s link builder emits plain URLs, and the minting function has no production call site. As shipped, an agent that receives an alert still needs an identity — a Cloudflare Access service token — to write back. The signed-link path is the next thing to wire in, and until then the docs overstate it.
What is real is agent.md. It is generated from a 17-entry ROUTES table in src/routes/agent-md.ts, and two tests keep it honest in both directions:
    const mounted = app(fakeDb().db).routes
      .filter((r) => r.path.startsWith('/api/'))
      .map((r) => `${r.method} ${r.path}`);

    const documented = new Set(ROUTES.map((r) => `${r.method} ${r.path}`));
    const undocumented = [...new Set(mounted)].filter((m) => !documented.has(m));
    expect(undocumented).toEqual([]);
and the mirror, documents no route that does not exist. The route replaced an earlier idea: shipping a skill file for agents to install. The file header says why — a static file that duplicates a live API drifts, and in practice never gets installed; the previous generation’s skill claimed 90-day retention for a system that kept 48 hours, and was never copied into the container it was meant for.
An agent that has triaged something writes its findings back with POST /api/incidents/:id/annotate, and the note appears on the incident next to the human comments. There is a worked receiver: thinkbot, which takes these alerts and correlates them against GitHub, Datadog and Sentry.
When the receiver is a Worker, skip the webhook
If the receiver lives on the same Cloudflare account, a service binding beats HTTP: the platform authenticates the call, so there is no shared HMAC secret to distribute or rotate, no public inbox to defend, and no replay window to reason about. The payload crosses as a structured value rather than a JSON string.
notifiers: [rpc({ binding: (env) => env.AGENT })]
The receiver is a WorkerEntrypoint with an alert(event) method. rpc() throws, rather than returning quietly, when the binding is missing — dispatch records delivery outcomes, and an unconfigured binding must show up there as a failure. A silent success is how a dead alert path stays invisible.
One sharp edge, stated in both repos: an RPC call carries no signature. Authenticity comes from the binding. Keep signature verification in the HTTP handler and do not let shared downstream code assume it ran. Service bindings are same-account only, so webhook() with hmac() remains the option for everyone else; its verifier rejects signatures older than DEFAULT_TOLERANCE_MS, five minutes.
A versioned payload, so a release is not an outage
Every alert carries schemaVersion, exported as ALERT_SCHEMA_VERSION, currently 1. The rule receivers can rely on is in the type’s comment: adding an optional field does not bump it — bodySnippet was added this way — and removing, renaming or retyping one does. Receivers should ignore unknown fields and must not hard-fail on a version higher than they know. A receiver that rejects unknown versions turns every clawdwatch release into a monitoring outage.
Arriving through the login proxy is not proof of identity
Mount it behind Cloudflare Access, Cloudflare’s login proxy. Reads are open by default; writes always require an identity.
There is no API key in the query string. URLs leak into logs, analytics and referrers, and a shared static secret has no identity, no expiry and no revocation. And arriving through Access is not treated as proof in itself, because anyone who learns the Worker’s direct address bypasses the proxy. So src/auth/jwt.ts fetches the team’s public signing keys from Access (cached for five minutes), refuses any signing algorithm but RS256, verifies the token’s signature against the named key, and checks its expiry, its not-before time, that it was issued for this application and that it was issued by this team. A token minted for another Access application must not work here; that is what keeps a leaked token scoped to this app.
The detail the previous implementation got wrong: a service token, the kind of identity a machine caller gets, carries no email address in its token. Its identity is in the common_name field. Code that only looks for an email silently rejects every machine caller, which is exactly the caller an agent integration needs. Both shapes are handled, and verification failures are returned as a flat 403 without the reason, because the reason tells an attacker which check failed.
No identity is stored. The JWT is verified for the decision and discarded; there are no email, IP or user-agent columns.
A dashboard that does not interpolate
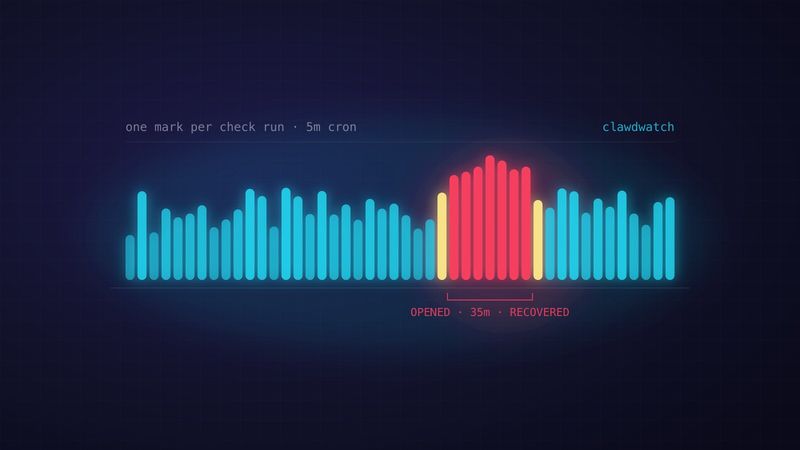
One mark per check run. The tick-strip component’s header explains the choice: a scheduled check produces separate samples, and a smoothed line between them would assert measurements that were never taken. Colour is status, height is response time against the check’s own ceiling, and the marks distinguish “responded badly” (a status code came back) from “unreachable” (no status code at all). Healthy marks are quieted in the stylesheet so amber and red carry the page.
Every delivery is recorded too, so the dashboard can answer the question monitoring tools are worst at: did the last alert actually arrive? That panel had a bug worth owning. Delivery rows are only written when an alert fires, so a failed delivery from initial setup sat red for six days with everything healthy — there was no next alert to overwrite it. The fix ages rows out: after 24 hours a chip renders grey as “last delivery failed”, which says what we actually know. The same commit found that pruneDeliveries was exported and unit-tested but had no production call site, so the table had grown for the life of the deploy.
Getting it running
npm create cloudflare@latest my-monitor -- \
  --template clawdwatch/clawdwatch/examples/worker
cd my-monitor

wrangler d1 create clawdwatch          # paste the id into wrangler.jsonc
npm run migrate
wrangler secret put SLACK_WEBHOOK_URL   # optional, and all Slack needs
npm run deploy
Or as a library, a route inside a Worker you already run:
import { createMonitor, slack } from 'clawdwatch';

const monitor = createMonitor<Env>({
  d1: (env) => env.MONITORING_DB,
  secrets: (env) => ({ SLACK_WEBHOOK_URL: env.SLACK_WEBHOOK_URL }),
  notifiers: [slack({ webhook: '${SLACK_WEBHOOK_URL}' })],
});

export default { fetch: monitor.fetch, scheduled: monitor.scheduled };
Defaults: a check every five minutes, a 10 s timeout, one retry after 5 s, three failures to open an alert, reminders hourly. Assertions cover status code, headers, body, response time and a value picked out of a JSON body — the last of which turns a health endpoint that returns {"db":"ok","queue":"degraded"} into a signal rather than a 200.
What this cost and what it bought
Triptech runs production APIs on Cloudflare Workers, and the monitoring options are a SaaS that bills per check and knows nothing about your account, or a Worker you write yourself and never quite finish. v2 was the second one: three storage systems, a state machine with no word for “still down”, and a skill file describing retention the system did not have.
Three things I would carry to the next project. Inject the clock and the id generator, and the state machine becomes 273 lines of tests that run in milliseconds. Do the secret scrub before the truncation, not after. And generate the document an agent reads from the same table that mounts the routes, with a test in each direction — it is the only kind of documentation that was still true a month later. The capability links are the open item; the docs describe them, the code signs them, and the orchestrator does not yet attach them.
Read the source, or start at getting started.