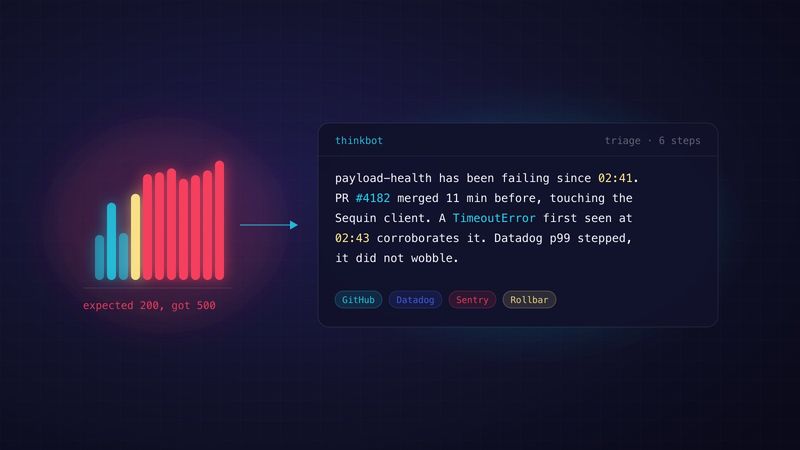
The companion piece to clawdwatch — thinkbot is a Triptech Travel open-source project, authored and released by Isaac Rowntree in his Triptech engineering capacity and cross-posted here on the Zack Design blog. It is a single Cloudflare Worker (a small program that runs on Cloudflare’s servers), 3,054 lines of TypeScript, that takes an alert, investigates it against GitHub, Datadog, Sentry and Cloudflare’s own Worker telemetry, and reports what changed in one paragraph — or replies with the single word NOTHING and posts nothing. It exists because a health endpoint returned an HTTP 500 error whose body named the failing dependency for five hours, while the alert carried only expected 200, got 500. MIT licensed.
This post walks through the mechanisms and the failures that shaped them: the ordered triage procedure in the prompt and the rule that a failed tool may never read as an all-clear; the three ways a Worker agent fails silently that I found by running it against live incidents (background work cancelled with no error, a bundle of static files answering “method not allowed” to every inbox, and a reasoning model using up its whole output budget before writing a word); the side-by-side model comparison that changed the default model; and the tool that found a stalled site eight earlier triage turns had called a test flake.
Source → github.com/triptechtravel/thinkbot · Docs → triptechtravel.github.io/thinkbot
The division of labour
The clawdwatch post made the case that detection should be deterministic: a threshold, a state machine, a maintenance window, and no model anywhere near the decision about whether you have a problem. thinkbot is what that decision buys you.
Detection is code you can read at 3am. Explanation is the part where a model earns its keep.
Once something is definitely broken, the work is reading five systems and noticing what they have in common. A check can tell you an endpoint returned 500. It cannot tell you that a pull request merged eleven minutes earlier, that a Sentry exception first appeared inside that window, and that a Datadog metric stepped rather than wobbled at the same moment.
The procedure is in the prompt, in order
OPS_SYSTEM_PROMPT in src/agent-ops.ts is an ordered procedure, not a vibe:
When you are handed an alert, work in this order:
  1. Confirm it is still failing. runCheckNow is cheap and stops you
     explaining an outage that has already passed.
  2. Look at the check history. A single blip and a sustained outage call for
     different responses.
  3. Look for what changed. Most outages follow a deploy, so recentDeploys on
     the relevant repository is usually the highest-value call.
  4. Look for corroboration: a new Sentry error that started inside the same
     window, or a Datadog metric that stepped rather than wobbled.
  5. Check whether this endpoint has failed before and what was concluded.
A turn may make at most twelve tool calls and run for at most 120 s, and each tool result is trimmed to 1,500 characters before it goes back to the model. Then it says what it found, citing the pull request number, the exception, the ratio. If the evidence does not support a cause it says the cause is unclear and lists what it ruled out — a confident wrong answer sends someone to the wrong service and costs more than an honest “unclear”.
The clause that took a real incident to write is this one:
NEVER report the absence of evidence as evidence of absence. If a tool errored,
returned nothing, or was not configured, say so in those words — "Sentry was
unreachable" is useful and "no new Sentry errors" is a lie that reads exactly
like an all-clear.
Findings worth keeping are written back with annotateIncident to the clawdwatch API at MONITORING_URL, authenticated with a Cloudflare Access service token. The signed per-incident action links described in the clawdwatch docs are not yet attached to alerts, so this is the standing credential thinkbot does hold — read scope on the sources, write on annotations.
Silence is a valid outcome
If triage found nothing that explains the failure, the model replies NOTHING and the channel gets nothing. The return contract is result.text.trim(): an empty string means “nothing worth saying” and the caller decides whether that becomes silence or a log line. triageAlert logs [alert] triage found nothing to report and returns.
An agent that always produces a paragraph will always produce a paragraph, and under an incident someone is trying to read, filler is worse than absence. Getting this right meant saying it three times over: in the prompt, in the return contract, and in each channel’s decision to post. Chat is the one exception, on purpose — a person waiting on a thread cannot tell a silent bot from a broken one, so answerChat always replies, with “I could not finish that one” if it must.
Two transports, one triage path
Service binding, preferred. A service binding is a direct call from one Worker to another on the same Cloudflare account, and clawdwatch calls the AlertInbox entry point that way:
"services": [
  { "binding": "AGENT", "service": "thinkbot", "entrypoint": "AlertInbox" }
]
The platform authenticates the call. No shared secret, no public endpoint.
Signed webhook, for anything that cannot bind. POST /hooks/clawdwatch verifies a keyed hash (an HMAC) over the timestamp and the body, using clawdwatch’s own exported verification function and header names rather than a local reimplementation, because two implementations of one signature scheme is a bug with a delay fuse.
And the sharp edge, stated in both repos: a direct Worker-to-Worker call carries no signature. The AlertInbox comment says there is correspondingly no check there, that the check belongs to the HTTP adapter, and that triageAlert is written not to assume it ran.
Failing CI runs get triaged the same way
POST /hooks/e2e takes a signed report from a GitHub Actions runner when the nightly browser test suite (Playwright) fails. A binding is not available — bindings are same-account only and a runner is not on the account — so this is a keyed hash under thinkbot’s own header names, x-thinkbot-signature and x-thinkbot-timestamp, with its own key, E2E_WEBHOOK_SECRET. That is a different key from the monitoring inbox: a CI runner is a different sender in a different trust domain, and leaking one key must not grant the other.
The payload is deliberately not a clawdwatch AlertEvent. A test run is not a synthetic check; there is no incident to annotate and no links to act on, so forging one would hand the agent a prompt telling it to call annotateIncident against an incident that does not exist. It carries repo, sha, runUrl, loadError, failures, passed and skipped, and the type guard checks only that repo and sha are strings — the signature proves key possession, not sensible content.
Two details earned the hard way:
loadErrorwith no failures is a distinct incident. The prompt branch says so in capitals: “E2E SUITE FAILED TO RUN … No tests executed, so this says nothing about whether the site is healthy.” Reporting that as “0 tests failed” is how a real two-night outage read as noise.- This path always posts. There is no second notifier behind it and nobody opens the Actions tab. The headline is the floor; the paragraph is what gets added.
Exercising the path that is not exercised
Removing the CI workflow’s own Slack step left one delivery path and no way to tell whether it worked. So a report may set "probe": true. It travels the same route and posts the same way — a probe down a different code path proves nothing about the one a real failure takes — but the headline is 🧪 … E2E alert path probe — delivery works, nothing is wrong, first and unmistakably, and the prompt short-circuits to “Reply with the single word NOTHING. Do not investigate.”
That last part is not an optimisation. An agent asked to explain a non-event will invent one.
The first real report answered 200 and posted nothing
The probe worked. Then the first real failure came through: 200 to the runner, no error in the logs, nothing in Slack, fifteen minutes on. The difference was that a probe’s model turn returns immediately and a real one makes tool calls.
The message was built as headline plus finding, inside the background work the Worker is allowed to keep doing after it has replied (waitUntil). So a slow turn swallowed the alert. The first fix split them: post the headline in the request itself — one Slack call, milliseconds — and let the finding follow as a second message. Worst case became a headline with no explanation, never an explanation nobody receives.
That was not the whole bug. Running recorded reports through the live deployment, one turn finished in 28 s and the rest were killed:
waitUntil() tasks did not complete within the allowed time after invocation
end and have been cancelled.
Background work gets about thirty seconds after the reply. A triage turn that makes four or five tool calls regularly needs more, and the runtime cancels it with no error and no message. The monitoring inbox had the same shape, which means clawdwatch triage had been dropping silently whenever it ran long — invisible by construction, because the thing that failed was the thing that would have told you.
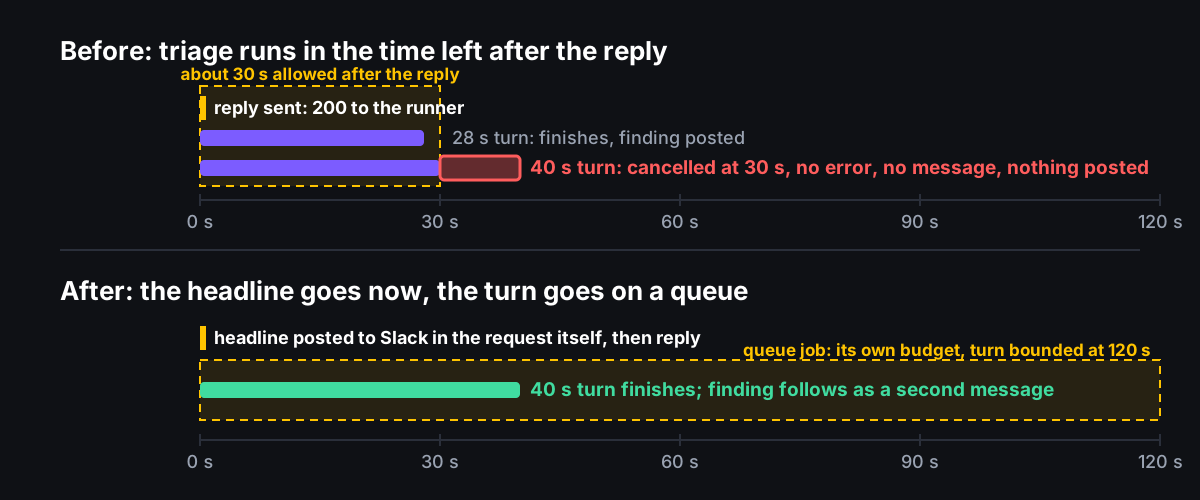
Every model turn now runs as a job on a Cloudflare queue instead:
  "queues": {
    "producers": [{ "queue": "thinkbot-triage", "binding": "TRIAGE_QUEUE" }],
    "consumers": [
      {
        "queue": "thinkbot-triage",
        "max_batch_size": 1,
        "max_batch_timeout": 0,
        "max_retries": 0,
        "dead_letter_queue": "thinkbot-triage-dlq"
      }
    ]
  },
Retries are off and every job is acked, including failed ones, because a retried turn may already have posted its finding, and a duplicate explanation under an incident someone is reading is worse than the missing one it recovers. The turn stays bounded at 120 s, below the consumer’s budget, so a hang leaves a log line saying so — the difference between “found nothing” and “never finished”.
Moving to a queue had a knock-on: everything an inbox receives has to survive being written out as JSON. The channel parsers used to hand back a reply function that remembered the Slack thread or Telegram chat it belonged to, and a function cannot go in a queue message. It is now a plain description of where to reply (the channel and either the Slack conversation and thread or the Telegram chat id), with a test that pins the one property that matters, that it survives the round trip through JSON.
Static assets are a second front door
thinkbot holds a GitHub personal access token, Datadog and Sentry keys, and write access to monitoring incidents. workers_dev and preview_urls are off and every route verifies its caller before doing any work. That was true of the routes and still not true of the deployment.
The Worker was scaffolded from Cloudflare’s agent starter template with a React chat page, and even after the page was disabled, deploy still built it and uploaded the bundle of static files. Static files are served before the Worker’s code runs. So the bundle answered requests no route guard ever saw, and that single fact produced three bugs:
- an unauthenticated
GETto the hostname returned the chat page; /healthanswered200with the chat page’s HTML instead of the health handler — a liveness endpoint that cannot fail, reporting healthy through the outage it exists to catch;- every signed inbox returned
405, “method not allowed”, because the static file handler rejects anything butGETrather than passing it on to the Worker. Verified against the live deployment:POSTto/hooks/clawdwatch,/hooks/slackand/healthalike. Monitoring never noticed, because it reaches thinkbot over the direct binding, which does not pass through the static files.
The first fix listed the paths that should reach the Worker first ("run_worker_first": ["/agents/*", "/oauth/*", "/hooks/*"]), then added /health to the list. That moves the boundary and leaves the rest in place. The real fix is having no static files at all: with the bundle gone, every request lands on the code that checks its caller. Deleting the chat page also dropped React, Tailwind, the Vite build and eleven packages; removing the now-unused chat agent’s Durable Object (Cloudflare’s single-instance stateful object) took two more packages with it, and the Worker bundle went from 2.8 MB to 1.2 MB.
One local trap, recorded only in the commit message and worth knowing if you mix Vite (the front-end build tool) and Wrangler (Cloudflare’s deploy tool): the front-end build writes a small config file under .wrangler/deploy/ that points Wrangler at the built dist/ folder instead of your source. Both are ignored by git, so a stale redirect keeps deploying the old bundle while ignoring your edits to wrangler.jsonc. Remove .wrangler/deploy and dist before the next deploy.
The model posted 256 exclamation marks
npm test mocks the model — 192 tests, 469 ms, free and offline. That is the right default, and it means the whole suite goes green whatever the model emits. On 2026-08-22 a collapsed generation put 256 exclamation marks into the alert channel under a live headline about three failing specs, where it read as the alerting itself having broken.
Nothing sat between the model’s output and Slack but an empty-string check and the word NOTHING. Now usableFinding() in src/triage-output.ts judges the output on properties, not quality: one character making up more than 40% of it, letters making up less than 35% of it, or fewer than 24 characters in total, and in each case it prefers silence. It cannot separate a correct diagnosis from a confident wrong one; no rule can.
The wall was exactly 256 characters, and ! is one token. That is Workers AI’s default completion cap, not a content limit, so maxOutputTokens is now set explicitly — which makes a collapse longer, and is only safe because the guard drops it first.
To exercise the model half at all, POST /hooks/e2e/dry-run runs the same prompt through the same turn behind the same signature and returns the result instead of posting it, and test/fixtures/ holds real payloads recovered from the workflow logs of the runs that produced them. Invented reports correlate with nothing. The integration test’s header is explicit about what it can check: that the output is prose, finished, hedged when the evidence is thin, and silent on a probe. Not that the diagnosis is right.
Two models on the same incident, and what neither found
scripts/triage-harness.mjs runs two models against the same recorded report. On 2026-08-22, six turns each:
gpt-oss-120b |
kimi-k2.6 |
|
|---|---|---|
| Collapsed into exclamation marks | once in six turns | never |
| When a tool had errored | wrote “no new Sentry/Rollbar errors”, a made-up all-clear | said the tool was inaccessible |
| Named the test framework | called Playwright “Cypress” | correctly |
| Tool calls to reach an answer | 9 to 11 | 3 to 5 |
| Time per turn | 20 to 32 s | 46 to 74 s |
A made-up negative is indistinguishable in an incident channel from a real all-clear, which decided it. The slower model is about twice as slow per turn, and this runs on a nightly, so the cost is nothing. DEFAULT_MODEL is @cf/moonshotai/kimi-k2.6 as of that run.
What the comparison did not show is either model finding the cause. Both concluded “test flake, site healthy” about an incident that was a server-side render stall, because no tool reached the place the evidence was. A better model would have been confidently wrong too.
The one source that would have been right
The site was stalling for 40–60 s on roughly a third of cold renders and truncating the HTML stream. Every source the agent could reach agreed it was healthy: nothing merged in the window, no new Sentry issue, no Datadog alert, and the uptime checks — which fetch a page and read the first byte — were green. A response that starts in 100 ms and never finishes is invisible to all of them. In the Worker’s own invocation telemetry it reads:
wallTime 59971ms, cpuTime 117ms, outcome canceled
A minute of elapsed time against a tenth of a second of processor time can only be a request stuck waiting on something else. So workerHealth in src/tools/workers.ts queries Cloudflare’s Worker telemetry and states the verdict rather than leaving it as arithmetic:
const STALL_WALL_MS = 10_000;
const STALL_RATIO = 20;
Over the real incident window it returns STALLED: p99 wall 52572ms against p99 CPU 1172ms — 45:1. That is a request waiting on I/O that never returns, NOT slow code. (the “p99” figures are the slowest one per cent of requests). Over the window after the fix: Healthy, with the slowest one per cent taking 6,538 ms. It returns totals and percentiles only, never log lines, which run to thousands a minute and carry request URLs and headers you then pay for in context on every later turn. Its first version asked the API for p50, which Cloudflare rejects with a failure flag and an empty error list, so it failed silently while every unit test passed; median is the supported spelling, and workers.itest.ts drives the real API to catch the next rename.
With the window supplied, triage reached the conclusion eight earlier turns had missed: “requests are starting and then stalling on I/O, not slow code. The uptime checks are all green because they measure first byte only. This is a failing site, not a failing test.”
The empty turns were the token ceiling
Even with the right tool, two runs in three did the most work — GitHub, Datadog, Worker telemetry across four or five steps — and then ended without writing the paragraph. Two fixes were reasoned to rather than measured: the first assumed a conversation-continuation problem, the second a malformed tool-call exchange. Both were plausible. Each was declared a fix on a sample too small to show otherwise.
Logging finishReason and usage settled it in one run:
finishReason=stop    outputTokens=153     1 turn
finishReason=length  outputTokens=2048    4 turns, both retries included
2,048 was the output budget. A reasoning model was spending the entire budget thinking and had nothing left to write, and the retry hit the same wall. Raised to 8,192: five runs after, five of five answered, no empty turns. The galling detail, now recorded beside MAX_OUTPUT_TOKENS so the number is never guessed at again: the comment on the old value already said the headroom was for “a reasoning model’s hidden tokens”. Right worry, wrong number.
A tool that cannot answer costs a step and a sentence
This deployment carried a Rollbar tool with an invalid token for months. Every triage turn spent one of its twelve steps to be told “forbidden”, and once the prompt required reporting sources that failed, every write-up carried “Rollbar could not be checked” as though it were a finding. Rollbar left the estate on 2026-08-22 and the tool went with it.
The general fix is structural. src/tools/registry.ts declares each provider as a name, the env vars it cannot work without, and a builder; a provider missing any of them is not offered at all — not offered and failing, not offered. GITHUB_OWNER and SENTRY_ORG have no defaults for the same reason a default would mean an unconfigured deployment quietly querying somebody else’s organisation. What a deployment knows about itself lives in ESTATE_NOTES, free-form prose appended to the system prompt and read by a model, not parsed. Baking one organisation’s inventory into the prompt is what makes a general tool unusable by anyone else, and stale for its owner the first time the estate changes.
Keep the dumb notifier
From the production configuration on the clawdwatch side:
notifiers: [
  slack({ webhook: '${SLACK_WEBHOOK_URL}' }),
  rpc({ name: 'thinkbot', binding: (env) => env.AGENT }),
]
Slack is listed first and deliberately kept. If the agent is the only alert path, an agent outage is a monitoring outage, and every failure above — the cancelled background work, the “method not allowed” from the static files, the exhausted token budget — would have been one. A failing notifier cannot affect the other, so the plain, model-free Slack message always goes out. If you take one idea from either project, take that one.
Try it
git clone https://github.com/triptechtravel/thinkbot
npm install && npm test
Then wrangler queues create thinkbot-triage-dlq and thinkbot-triage, give it tokens for whichever sources you use, tell it who you are with GITHUB_OWNER and SENTRY_ORG, and point clawdwatch at it. SETUP.md is the short version; SECURITY.md is worth reading first if you plan to turn on captureBodyOnFailure for endpoints whose error paths can return personal data.
What building it taught me, in order of cost: measure before diagnosing, because two of the fixes above were reasoned to and wrong; an agent’s worst failures are silent ones, so every path needs a floor that does not depend on the model; and the tool set should be the estate’s, not the author’s. The next open item is on the clawdwatch side — attaching the signed action links so annotateIncident can drop its standing credential.