CamperMate ships nine offline base-map archives for Australia and New Zealand, 3.7 GB in total, built from OpenStreetMap with planetiler (which turns raw map data into tiles) and tileserver-gl (which draws them), and served from Cloudflare R2, Cloudflare’s file storage. The first tier, published in May 2026, was one zoom level coarser than every filename claimed, had 752 blank tiles in Tasmania alone, and drew an opaque blank rectangle over New South Wales wherever Victoria was installed on top of it. The build log for every one of those archives said done.
This is the pipeline as it runs now, with the mechanisms that took it from there to here: the one line in tileserver-gl that makes its 256-pixel tiles come from the zoom level above; labels that shrink to half size when you fix that; a warm-up probe that never reached the server instance it was warming; per-state map extracts that stop at a state line the archive’s box crosses; a continent-scale tile no clipping margin can fix; a storage layout for duplicate tiles, measured on WebP rather than remembered from PNG; and the hole Apple’s tile renderer leaves on every pinch, closed by porting MapLibre’s tile pyramid. It was built for CamperMate — the free-camping and campground app across Australia and New Zealand, iOS and Android, 1M+ downloads, made at Triptech Travel — whose users are in Fiordland, Kakadu and the Pilbara, where the map has to work without bars. The output is an MBTiles file, a single SQLite database holding every tile, which any client can read; the React Native consumer is at the end.
The standard recipe draws a map from 2013
The first thing every “offline OpenStreetMap tiles” guide tells you is to run overv/openstreetmap-tile-server, which loads the map data into a PostGIS database and has Mapnik draw it in the same style as openstreetmap.org. I tried it. It works, and the output looks like 2013: olive land use, mustard buildings, brick motorways. It is also one stage, so a different look means editing the style language and re-drawing everything from the database. That was the whole evaluation; I moved on.
Split the data from the drawing
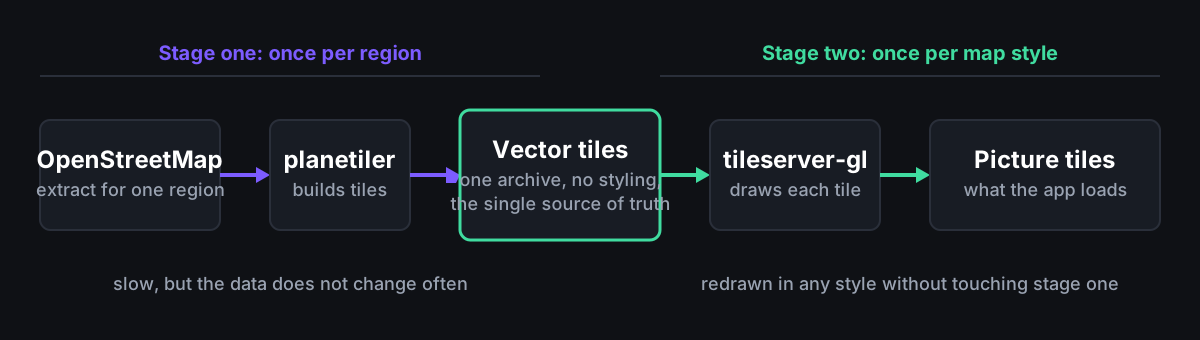
Two stages. The vector archive holds the map as shapes and labels in the OpenMapTiles layout, with no styling. The picture archive is what the app loads, and it can be redrawn in any MapLibre GL style without touching the data stage. The renderer is MapLibre GL Native, the same engine behind MapLibre GL JS, which is why the tiles look like a modern web map: they are one, drawn offline.
| Tool | Job | License |
|---|---|---|
| Geofabrik | OpenStreetMap source data as PBF files, plus a .poly outline per extract |
ODbL |
osmium-tool |
Cut a national map extract down to a region’s outline | GPL-3 |
planetiler |
Turn a map extract into a vector tile archive (OpenMapTiles layout) | Apache-2 |
tileserver-gl |
Draw vector tiles in a chosen style into PNG pictures, using MapLibre GL Native | BSD-2 |
cwebp (libwebp) |
Encode pictures as WebP at quality 80; the packer now calls the same library in-process through Pillow at the same settings | BSD |
| OpenMapTiles fonts | Pre-built font glyph files for drawing labels | OFL |
| OpenMapTiles styles | Free MapLibre GL styles (Positron, OSM Bright, Dark Matter) | BSD-3 |
No API keys. The whole stack runs on a MacBook.
The build, as it runs
scripts/regions.json is the source of truth: source extract, bounding box, deepest zoom, style, clip outline and margin per region. scripts/rebuild-from-manifest.sh reads it and runs, per region:
Geofabrik national PBF
  → osmium extract   (clip to polygon + margin + EXTRACT_DELTA_DEG)
  → planetiler       (vector .mbtiles, OpenMapTiles schema, clipped to polygon + margin)
  → tileserver-gl    (render each vector tile via the /512/ route)
  → render-and-pack  (downscale 512→256, unsharp, WebP q80, dedup) → <region>.mbtiles
  → apply-lowzoom-base (overwrite z≤9 with the shared national base)
build-offline-tiles-fast.sh is one region of that; render-and-pack-deduped.py is the draw, encode and pack step, 620 lines. Four things in there that each cost a day:
- Planetiler needs Java 21. macOS’s Java locator (
/usr/libexec/java_home -v 21) returns the closest match rather than failing, so on a machine with only Java 17 installed it returns the 17 path and reports success, and planetiler dies with a class-version error. The script runsjava -versionon each candidate and checks the major version itself. It also runs the released jar, not the container: adocker pull ghcr.io/onthegomap/planetileronce burned 13 hours with no bytes and no error, because Docker asks the macOS keychain for aghcr.iocredential entry that exists but holds nothing, and blocks. - OpenMapTiles styles point at
api.maptiler.comand need a key. The build rewrites the style’s data source to the local archive withjq, repoints every layer at it, and sets the font path to the local glyph files. - The font glyph files are not on the
openmaptiles/fontsmaster branch, which has only the source font files. They are the v2.0 release asset, about 74 MB. Without them tileserver-gl returns a server error on every tile with a label. - Planetiler’s
boundsandcentermetadata upset MapLibre GL Native. The build deletes those two rows from the archive’s metadata table after planetiler runs.
Both images track :latest on purpose, and each build writes the resolved digest into the archive (planetiler_version on the vector side, tileserver_version on the raster). Working out which renderer produced the May archives was impossible, which is why the next section took as long as it did to place.
tileserver-gl’s 256-pixel tiles are a zoom level short
I expected a request for a 256-pixel tile at zoom z (/styles/{id}/{z}/{x}/{y}.png) to be drawn from the vector tile at zoom z. It is drawn from the vector tile one zoom level up. The comment is in serve_rendered.js: “For 512px tiles, use the actual maplibre-native zoom. For 256px tiles, use zoom - 1.” MapLibre’s vector tiles are 512 pixels across, so a 256-pixel tile at zoom z covers exactly one quarter of the tile one level up, and that is the one it is drawn from.
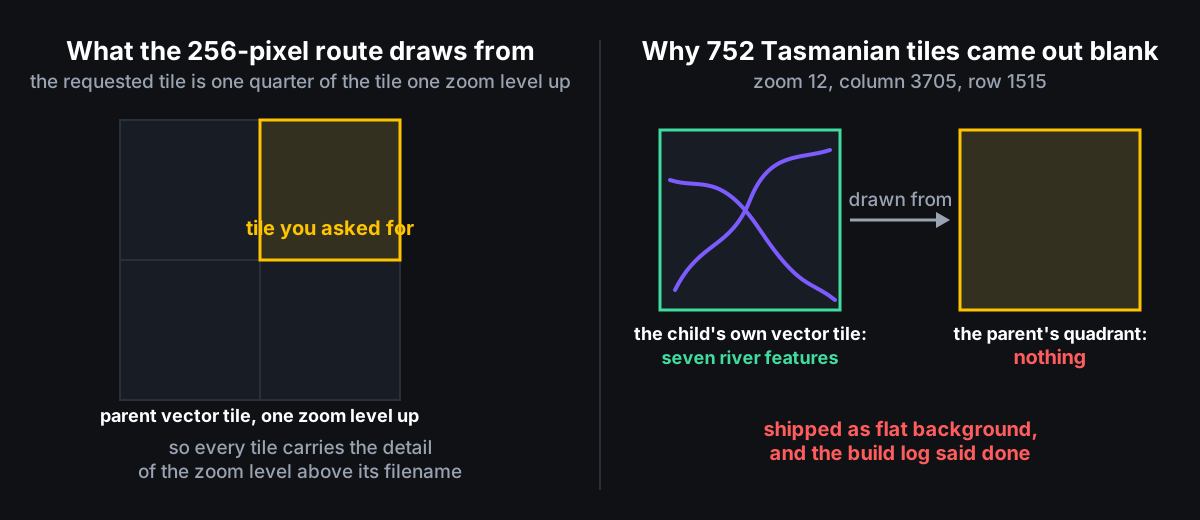
Two consequences. Every archive built through that route carries the detail of the level above its filename, at the same tile count and the same byte cost. And any tile whose corner of the parent is empty comes out blank even when the tile’s own data has features. The worked case is the Tasmanian tile at zoom 12, column 3705, row 1515: its own vector tile carries seven river features (the Looker and Andrew Rivers, inside Franklin-Gordon Wild Rivers National Park), inside the tile, matching the style’s filters, and the style would paint them as a light-blue line about one pixel wide; the parent at zoom 11 has nothing in that quarter, so the tile shipped as flat background. 752 tiles in Tasmania alone.
The fix is to request the 512-pixel version of each tile (/styles/{id}/512/{z}/{x}/{y}.png) and shrink it to the 256-pixel tile we ship. The packer’s URL builder now refuses to build the bare route. This also makes the packer’s duplicate detection correct, because only at the tile’s own zoom is a drawing a pure function of that tile’s own vector bytes.
Fixing that created the next problem. The 512-pixel canvas covers the same ground as the 256-pixel tile, so text set at 12 pixels in the style is 12 pixels on the canvas and 6 pixels on the phone. Unreadable. Asking for the double-resolution variant (@2x) does not help: it scales canvas and text together and leaves the ratio unchanged. scripts/scale-style-sizes.py doubles the style’s pixel dimensions (text size, icon size, line width, text halo width and offsets) before drawing, leaving zoom stops, opacities and font-relative offsets alone.
And shrinking a picture smears the lettering. Measured on one Queenstown tile at zoom 14, counting the mid-grey pixels that surround each solid dark pixel of text:
| How the tile was made | Mid-grey pixels per dark pixel |
|---|---|
| drawn directly at 256 pixels | 2.4 |
| the old 256-pixel route | 2.5 |
| 512-pixel route, plain shrink, Lanczos filter | 6.4 |
| 512-pixel route, plain shrink, Hamming filter | 7.3 |
| 512-pixel route, shrink, then sharpen (radius 1.0, 60%, threshold 3) | 2.8 |
Filter choice barely moves it; the smear is inherent to draw-then-shrink. The sharpening pass costs about 20% more bytes. Shipping 512-pixel tiles outright would cost 162% more.
A freshly started tile server returns success
A freshly started tileserver-gl answers before its style and fonts have loaded, and the tiles it returns in that window are bare background, which the packer wrote as success. The build runs several tileserver instances and routes each tile to one of them by a hash of its coordinates. The first warm-up probed six tiles through that same routing, so an instance could receive no probe at all, stay cold, and let the check print warm (0s). That produced between 20 and 2,905 baked-in blank tiles in each of six regions (880, 20, 126, 2,905, 107 and 1,371) in one rebuild, every one of which then passed validation.
The warm-up now sends the eight most detailed representative tiles to every instance and returns true only when all of them draw something, with a 120 s deadline that fails the build rather than warning. Then the renderer refetches any tile that has features but comes back blank, up to four times.
“Blank” needed defining too. “Near-uniform and light” counted solid woodland, which the OSM Bright style paints as a very faint wash and draws as a flat pale green (RGB 233, 236, 223), and glacier, white at 30% opacity (RGB 250, 247, 244), as empty. That misread 297 correctly drawn Tasmanian tiles, and most of the Southern Alps. Blank now means within one step per colour channel of the style’s background colour (RGB 248, 244, 240), and every script that decides it shares that definition. Twenty Tasmanian tiles still draw blank after retries, and they are correct: their only features are national park boundaries, minor administrative boundaries and mountain peaks, none of which OSM Bright paints. The counter is advisory; validate-mbtiles-coverage.py, which checks each tile against the vector source rather than against a solid rectangle, is the gate.
Per-state extracts blank the neighbouring state
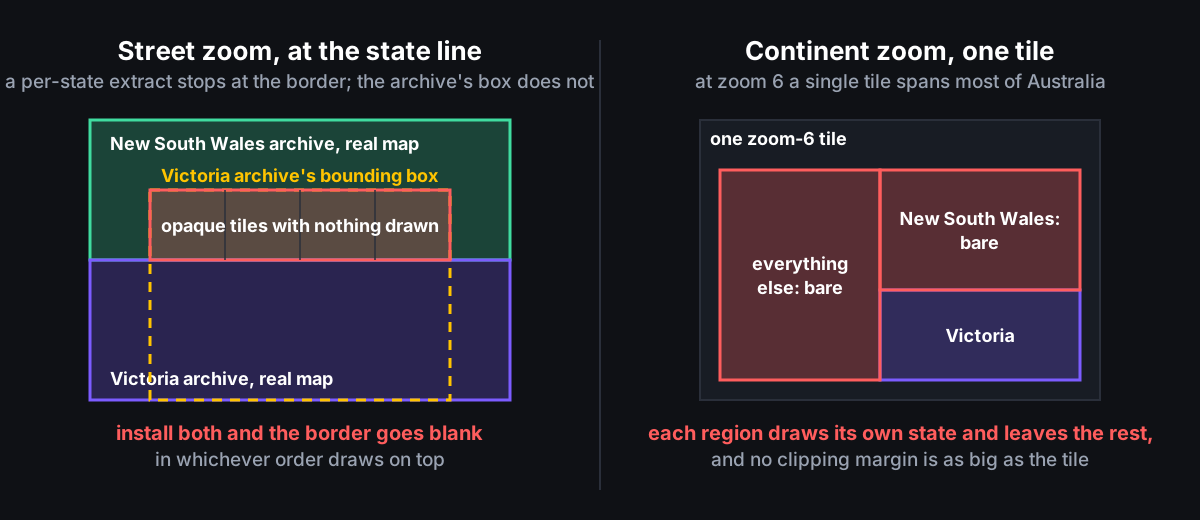
The Australian regions came from Geofabrik’s per-state map extracts, which exist and need no cutting. A per-state extract stops at the state line, but a region’s bounding box crosses it, so the Victoria archive held tiles for New South Wales ground with nothing drawn on them, and being opaque layers at the same stacking level they painted over the New South Wales archive’s real map.
Regions now come from the national extract. Each is cut to Geofabrik’s outline for the region plus a declared margin, a quarter of a degree in regions.json, and then limited to the region’s bounding box. The limit matters: Tasmania’s outline is a ten-point box reaching 161 degrees east and 56 degrees south because Tasmania administers Macquarie Island 1,500 km away, and adding a margin to it claims a tract of Southern Ocean. The hand-drawn rectangles it replaced overlapped by up to nine degrees of longitude between New South Wales and Victoria.
There are two cuts, and they are deliberately different widths. Planetiler emits any tile that touches the outline; osmium only supplies data inside it. Cut both to the same shape and edge tiles ship with a sliver of map. The data extract is cut 0.12 degrees wider than the tiles are. repair-sliver-tiles.py exists because of exactly this on the border between South Australia and Victoria, which runs north to south almost parallel to the tile grid.
The wide views belong to the whole country
Cutting fixes borders at street zoom and cannot fix them at continent zoom. At zoom 6 a single tile spans most of Australia, every region draws that tile from its own cut-down data, and each draws its own state and leaves the rest bare (the right-hand panel above). Measured agreement between neighbouring archives before the fix:
| Zoom level | Agreement between neighbours |
|---|---|
| 6 | 0–60% |
| 8 | 17–96% |
| 10 | 73–100% |
| 12 | 83–100% |
| 14 | 100% |
No margin helps; the tile is larger than any sane margin. The fix is what Organic Maps does with its world file: draw the wide zoom levels once from the uncut national extract and copy the identical set into every region. apply-lowzoom-base.py overwrites zoom 9 and below in each archive as part of the build. Measured on the Australian base archive, each level roughly triples: zoom 9 is 3,534 tiles and 5.8 MB, zoom 10 is 13,763 and 14.4 MB, zoom 11 is 52,706 and 44.2 MB. The shared base file for zooms 0 to 9 is 10 MB for Australia and 1.6 MB for New Zealand.
The gate is scripts/tests/test_region_overlap.py: for six overlapping pairs of regions at zooms 6, 8, 10, 11, 12 and 14, tiles present in both archives must draw the same picture, compared pixel by pixel, to at least 95% agreement, because a tile with one state’s half drawn is not blank, it is wrong. Zooms 10 and 11 are sampled on purpose: zoom 10 is the first level each region draws for itself, so it inherits the risk the shared base removes below it, and if it ever fails the base goes one level deeper. The gate sits at 36 of 36. One pair sat at 37% when this started.
How deep to draw
Each zoom level quadruples the tile count, and tiles with ink on them compress worse than empty ones. Measured on the current au-nsw.mbtiles:
| Zoom level | Tiles | MB |
|---|---|---|
| 12 | 15,211 | 26.5 |
| 13 | 57,199 | 95.0 |
| 14 | 209,424 | 278.6 |
The deepest level is 64% of the archive’s 433 MB of tile bytes. That is the whole argument in one table.
New Zealand’s deepest drawn level is zoom 15 and Australia’s is zoom 14, with the app enlarging tiles past that: four times fewer tiles across a continent, and New Zealand small enough that the extra level is affordable. That deepest level is where the 512-pixel route earns its keep. Drawn through the 256-pixel route, a zoom-15 archive carries zoom-14 detail; drawn through the 512-pixel route and shrunk, it carries the detail the number promises for the same tile count. One more zoom level costs roughly three times the archive. Fixing the route costs nothing.
Storing each identical tile once, measured on WebP
The MBTiles specification allows a layout where identical tiles share one stored copy, and the packer writes it:
CREATE TABLE images (tile_id TEXT PRIMARY KEY, tile_data BLOB);
CREATE TABLE map (zoom_level, tile_column, tile_row, tile_id);
CREATE UNIQUE INDEX map_index ON map (zoom_level, tile_column, tile_row);
CREATE VIEW tiles AS
  SELECT map.zoom_level, map.tile_column, map.tile_row, images.tile_data
  FROM map JOIN images ON images.tile_id = map.tile_id;
The tile id is a hash of the tile’s bytes, so identical tiles collapse to one row in images. The tiles view makes it transparent: the one query both native readers run, tile data by zoom, column and row, works against either layout.
The duplicate handling that pays is earlier, at the vector stage. Planetiler’s output already stores each distinct tile once: byte-identical vector tiles share one data id, and in Western Australia about 70% of tiles are duplicate desert. The packer groups tiles by that data id and zoom level, draws one representative per group, and maps every coordinate in the group to the result. Grouped by zoom as well, not by the bytes alone, because the same vector bytes draw differently at different zooms. Western Australia drew in 9 minutes against about 45 for the naive one-tile-at-a-time loop.
I remembered the shared-copy layout as a 50% saving, from the PNG era. Measured on the shipping WebP archives:
| Region | Tile positions | Distinct pictures | Flat layout (MB) | Shared-copy layout (MB) |
|---|---|---|---|---|
| nz-south | 857,288 | 241,253 | 484.1 | 362.6 |
| au-wa | 806,607 | 246,804 | 389.5 | 280.7 |
| au-nsw | 304,356 | 214,936 | 433.2 | 415.9 |
On the South Island 72% of coordinates point at a shared picture, and the byte saving is 25%, because the tiles that share are the cheap ones. SQLite’s own storage report puts the coordinate table at 48.2 MB and the picture index at 13.7 MB, both of which a flat table would not carry, so the net saving is about 60 MB, 11% of a 542 MB file. On New South Wales, which is mostly ink, it is 4%. The layout is still worth having, but WebP took most of what it used to give.
WebP at quality 80
PNG is what tileserver-gl emits and the wrong format for smoothed lines and faint land-cover washes, which do not reduce to a small palette. Measured on 1,000 Tasmanian tiles, WebP at quality 80 produced 19.4% of the PNG byte count, and the projected size of the tier fell from about 10.7 GB to about 2 GB. Both platforms decode it natively, iOS since version 14 and Android since API level 14, and both native readers pass raw bytes straight through. The archive’s format metadata says webp so the specification stays honest.
The encoding happens inside the packer. The first version launched the cwebp program with two temporary files per tile, about 35,000 launches and 70,000 temporary writes for Tasmania alone; Pillow’s encoder at the same quality and compression effort replaced it. Separately, SQLite’s write-ahead-log mode during the build, commits batched per 200 tiles and 16 client threads (tileserver-gl keeps between 8 and 16 renderers, so 8 threads left half of them idle) took Tasmania from 477 s to 259 s, with byte-identical output at either thread count. The archive is switched back to ordinary journal mode and compacted before it ships, so there is no log file beside it.
What the tier costs now
The archives from before the September rebuild are still on disk beside the current ones:
| Region | Before (MB) | Now (MB) |
|---|---|---|
| Queensland | 442 | 693 |
| North Island | 468 | 617 |
| New South Wales | 334 | 564 |
| South Island | 426 | 542 |
| Western Australia | 312 | 426 |
| Victoria | 178 | 320 |
| South Australia | 172 | 251 |
| Northern Territory | 109 | 165 |
| Tasmania | 65 | 117 |
| total | 2,506 | 3,695 |
Every megabyte of the difference buys something a user can see: real cross-border content where per-state extracts left blanks, labels at double size to survive the shrink, the sharpening pass at about 20%, and the shared base. One thing I did not expect: drawing at the tile’s own zoom alone made every archive slightly smaller (New South Wales went from 334 MB to 309 MB) before the label and border work took it up; I have not investigated why. Dropping OSM Bright’s water-pattern layer, a repeating wave image that turns flat water into two-tone noise, saved about 17% on a water-heavy sample and is on for every region.
R2 charges nothing when devices download from it, which is the reason it is R2 and not Amazon S3. The catch is on the way in: uploads go through the S3-compatible API because Cloudflare’s own upload command stops at 300 MiB, under half our regions, and the download host serves the archives with a 30-day cache lifetime, so replacing a file without purging the cache leaves Cloudflare’s edge handing out the old file for up to 30 days. publish-offline-map.sh purges and then verifies by downloading a byte range of the new file rather than just its headers, because a headers-only request reports the new version while a plain download can still be served the old cached copy.
Shipping it in React Native
The pipeline does not care what reads it. Web clients can read the archive through MapLibre GL JS and the mbtiles protocol plugin; Flutter has flutter_map with MBTiles plugins. CamperMate’s map is react-native-maps, which wraps Google Maps on Android and Apple’s MapKit on iOS, and its tile layer component (<UrlTile>) expects a web address pattern to fetch tiles from.
Three obvious options, all bad: unpack the archive into one file per tile on disk and use the local-file tile component, losing the single-file archive; run a small web server inside the app, paying startup, port management and battery; or replace the map view with MapLibre’s React Native component and rewrite every marker, callout and gesture. The fourth is a native patch that teaches the tile component an mbtiles:// address scheme, so the component in components/map/OfflineTilesRenderer.tsx stays ordinary:
<UrlTile
  key={`mbtiles-${region.regionId}`}
  urlTemplate={`mbtiles://${getMbtilesFile(region.regionId).uri.replace(/^file:\/\//, "")}`}
  minimumZ={region.minZoom}
  maximumNativeZ={region.maxNativeZ}
  maximumZ={region.maxZoom}
  zIndex={1000}
  shouldReplaceMapContent={process.env.EXPO_OS === "android"}
/>
The file path is worked out again from the region id on every render rather than read from the app’s saved state, because iOS moves the app’s storage folder to a new name on every upgrade, and a saved absolute path made downloaded regions vanish after an update. Replacing the base map is Android-only, because on iOS replacing it hides it everywhere, blanking everything outside the installed regions.
On Android the patch adds a reader for the archive (184 lines) and a compositor (102) and routes mbtiles:// requests through Google’s tile provider: past the deepest drawn zoom it crops and enlarges the parent tile, and below that it stitches the four child tiles from the next zoom down into one 512-pixel tile so Google Maps draws twice the linear detail, with a 24 MB most-recently-used cache on the stitched output. Google’s tile overlay owns tile management, pyramid included, so that is all Android needs. The readers on both platforms check the file’s size and modification time on every lookup, because a region deleted and re-downloaded lands at the same path, and a cached file handle kept reading the deleted file until restart.
iOS is where the work is, because MapKit gives you nothing. Apple’s tile renderer draws only the current zoom level and draws nothing where those tiles have not loaded, so every pinch punched a hole straight through the offline layer to Apple’s base map, and left grey hairlines at tile seams. MapLibre, Google and Leaflet all keep a pyramid of loaded tiles and stand in with the nearest loaded ancestor, scaled up.
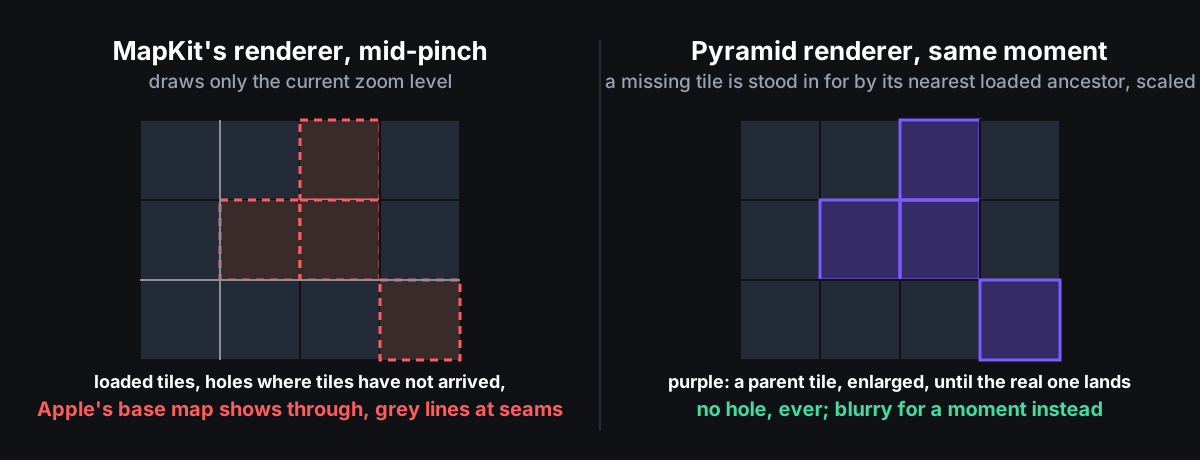
So the patch installs its own overlay renderer, AIRMapMBTilesRenderer, which always tells MapKit it can draw and draws from a pyramid.
My first pyramid got the shape right and the details wrong: it consulted parents before children, drew one stand-in instead of the children it had plus a parent behind them, and kept no record of which tiles it had already checked, so neighbouring tiles each re-walked the same chain of parents. AIRMapTilePyramid.swift is now a port of MapLibre Native’s tile-selection routine (algorithm::updateRenderables) and its tile-id types, under their BSD-2 notice, with upstream’s tests ported alongside so the preference order is testable. It lives in its own small Swift package, modules/mbtiles-tiles, 1,054 lines plus 24 XCTest cases (Apple’s test framework), because adding any Swift to the react-native-maps package makes the build tool generate a combined header that fails on the C++ in React’s generated files.
Five things the simulator could not show and a pinch on a device did. iOS decodes an image lazily, so every tile was being decoded inside MapKit’s draw call; tiles are now decoded as soon as they load. Decoding ran on the one-at-a-time read queue, so tiles arrived one at a time. MapKit’s “repaint this area” call only repaints while the map is still at the scale it was given, and the scale was captured when the tile was requested, stale by the time the tile landed mid-pinch, so correct tiles sat in the cache under a blurry ancestor; repaints are now scale-independent and merged into one per frame. The archives are sparse, so “row absent” at the deepest declared zoom was punching dead patches into covered ground. And every region carries the same wide-zoom base, each with its own renderer at the same stacking level, so one region’s blurry world tile landed on another’s detail by draw order; each renderer now ignores tiles outside its own archive’s bounds. That last one is what made the North Island look broken while the South looked fine.
Retina came out of a review question about whether owning the renderer costs resolution. It does not: tile renderers pick the zoom level from screen size and expect the provider to return a bigger image, which Android does with its stitched tile. iOS draws one level deeper instead, four 256-pixel tiles over the same ground being the same pixels as one 512-pixel tile, capped at the deepest drawn zoom because past it the deeper tiles are crops of the same parent. The offline map had been drawing at half Android’s detail on every iOS retina screen since May.
The geometry both platforms share is utils/tileMath.ts, 24 tests derived from the maths of the Web Mercator map projection; the native test projects under native-tests/ compile the real patched sources by reference, five tests with real graphics on Android under Robolectric (a tool that runs Android code on a laptop) and the XCTest bundle on iOS. I intend to open-source the module.
Style picks
All render against the same vector MBTiles, so the choice changes which file ships and nothing upstream:
- Positron — minimal, white, designed as a backdrop for other content. Wrong when the map is the content.
- OSM Bright — what ships. Coloured roads, green parks, motorway shields, full POI labels.
- Dark Matter — Positron’s dark-mode equivalent, a future night-mode option.
- Voyager — CARTO’s, not OpenMapTiles’. There is no
openmaptiles/voyager-gl-stylerepository, so the address you find beside the other three returns a 404. Fetch it from CARTO’s own servers; its layers use the plain OpenMapTiles layout but its data source is namedcarto, which the local rewrite normalises, and it asks for Montserrat and two Chinese, Japanese and Korean typefaces the OpenMapTiles bundle lacks, so tileserver-gl logsFont not foundand falls back to Noto Sans. Labels draw fine; the noise is expected.
What I would check first next time
Read the renderer’s request handler before trusting the request’s name; the “zoom minus one” line was in serve_rendered.js the whole time. Gate the build on a coverage check against the vector source, because a packer that prints done for 752 blank tiles will upload them. Compare overlapping archives pixel for pixel across the zoom range, not at one level, or a defect that affects every pair looks like one pair’s bug. And record the exact version of every tool that tracks latest in the file it produced.
The tools are mature and the licensing is permissive (OSM is ODbL, the OpenMapTiles styles are BSD-3, planetiler is Apache-2, tileserver-gl is BSD-2). The scripts, the 130 fast tests and the overlap gate are in scripts/ of the CamperMate app. If you are heading to Australia or New Zealand and want to see the tiles in production, grab CamperMate on iOS or Android — free, no account required, offline maps under the “Offline Maps” tab.
Header photo by Marek Piwnicki on Unsplash.